

Convincing Features

Assignment Type
Subject
Uploaded by Malaysia Assignment Help
Date
Tutorial 2a: Qualitative Data
A sample of 25 young executives was taken at random. Each executive was asked to choose only one of the five listed models of national cars according to their preference; Myvi, Saga, Viva, Persona, and Alza. Their responses are as follows:
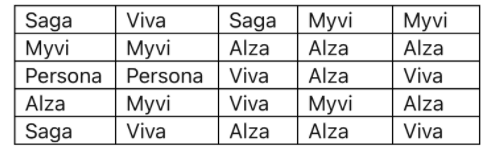
a. Construct a frequency distribution table with the relative frequency and percentage.
b. Construct a bar chart.
The following table shows the number of visitors to a park from January to April:
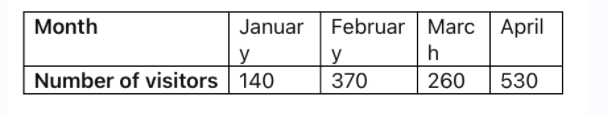
i. Construct the frequency distribution with relative frequency and percentages.
ii. Construct a bar chart and pie chart for the table given.
iii. What is the percentage number of visitors in April?
The table below shows the number of students for each type of transport used by a group of students to go to college:

Construct a bar chart and pie chart for the data given.
The following data represent the colour of men’s dress shirts purchased in the men’s department of a large department store. Construct a frequency distribution with relative frequency and percentages. Then draw a bar chart and pie chart for the data. (W-white, BL=blue, BR=brown, Y=yellow, G-gray).
W W BR Y BL BL W W W WY G
BL BR BL BR BL BL BRY BL G W
BL W W BL W BL BR Y BL G BR G
BR W W BR Y W BLY WW BL W
BR G G
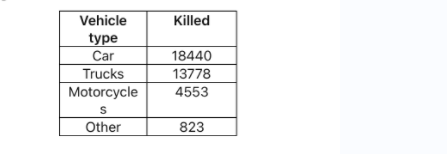
The numbers of motor vehicle occupants killed in crashes in 2005 are shown in the table. Draw a pie chart to organize the data.
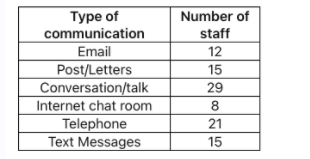
The number of staff use the types of communication are shown in the table. Draw a bar chart.
Are you a Malaysian student looking for help with your statistics assignments? Our online assignment helper in Malaysia is here for you! You can pay someone to complete my statistics assignment and enjoy affordable, high-quality services that meet your needs. With our homework helper at affordable prices, you’ll receive 100% human-written assignments that guarantee an A+ with on-time delivery and plagiarism-free content. Get the support you need to excel in your studies today!

