

Convincing Features

Assignment Type
Subject
Uploaded by Malaysia Assignment Help
Date
Q1(a) A hotel asked its customers to rate their stay as Good, Average or Poor. The following contingency table shows the frequency of each rating as well as the age group of the customers.
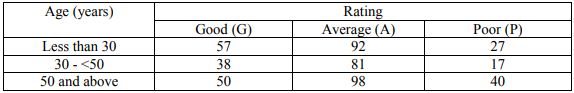
(i) Show whether there is any evidence of a significant association between age group and rating of customers.
(ii) Construct a 98% confidence interval for the true proportion of customers giving a good rating. Thus, interpreting the answer.
(iii) It is claimed that the proportion of customers who are 50 years old and above and give a poor rating to the hotel is more than 5%. Can the claim be supported at a 5% level of significance?
(b) A standard intelligence test has been given to university students for several years and it is assumed that the scores are normally distributed with an average of 70 and a standard deviation of 10.
A group of 30 university students obtained a mean grade of 65 in the examination this year. Is this year’s university students inferior in intelligence to the past years’ university students using a 1% level of significance?
(c) (i) A manufacturer of light bulbs believes that one particular brand of light bulbs has a lifetime of 30000 hours. A simple random sample of 100 light bulbs is taken and the mean lifetime is found to be 29500 hours with a standard deviation of 1270 hours. Test the manufacturer’s claim at a 5% level of significance.
(ii) Find a 96% confidence interval estimate for the mean lifetime of all light bulbs produced by this manufacturer.
Q2 The following table contains information on age, monthly income, health condition, and frequency of exercise last month of 10 respondents.
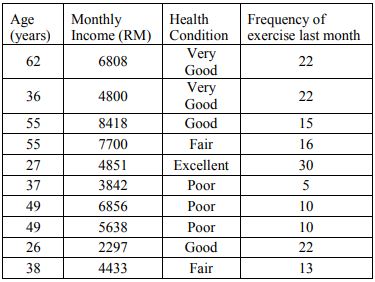
(a) Calculate the product-moment correlation coefficient between the age and the monthly income. Hence, interpret the value obtained.
(b) Draw a scatter diagram to represent the relationship between age and monthly income. Interpret your result. Determine the least-squares regression line of monthly income on the age of respondents. Draw the regression line on the scatter diagram.
(c) Calculate the coefficient of determination and interpret your result.
(d) Explain briefly about the data what the value of ‘b’ represented.
(e) Estimate the monthly income for the respondent who is 60 years old. Comment on the accuracy of the estimate obtained.
(f) Calculate Spearman’s rank correlation coefficient between health condition and frequency of exercise last month. Hence, comment on the result obtained.
Our professional experts at Malaysiaassignmenthelp.com offer an affordable BAMS1743: Quantitative Methods Assignment solution to the Open University (OU) students. our Kuala Lumpur Assignment experts are extremely qualified to provide the fastest way to get quality assignment solutions on any subject so that you will get HD rank in your assignment.

